07 August 2019
Announcing Geocode Earth status

Today we’re announcing www.geocodeearthstatus.com to help our users stay up to date about the status of our service.
Hopefully, this page will continue to look very boring, like the real screenshot above. However, we are no stranger to the realities of running web services. At some point, for some reason, something will not go as planned.
When that happens, we’d rather have everyone know than have to second guess if our service is working.
That’s why we’re using an external page from StatusPage, since there’s nothing more embarrassing than your status page being down along with your service.
While we’re here, we might as well talk a little bit about how we keep our infrastructure reliable.

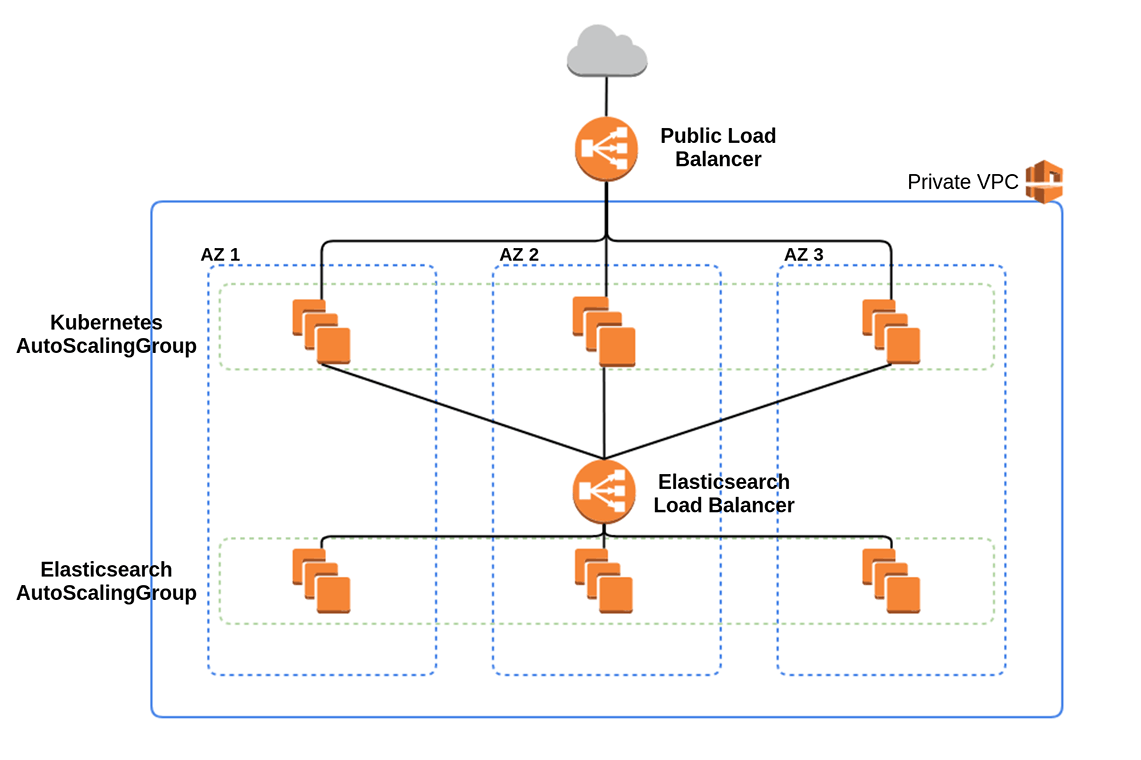
At a most basic level, we use AWS with our services spread across three availability zones in a single region. In the future, we’ll also expand to several regions for even higher reliability, as well as improved response times for global usage.
All the individual components of our architecture run across all three of these availability zones, and even a complete failure of a single zone is not enough to seriously impact our systems.
Our entire infrastructure runs in a Private VPC, with no outside network access except through our primary load balancer, which allows only incoming traffic, and a NAT gateway, which allows outbound traffic for limited use.
The foundational configuration for our use of AWS is all managed through Terraform.
We’ve found infrastructure as code immensely helpful for at least the following reasons:
- Changes can be made systematically and reviewed carefully just like any other code
- Knowledge of how our systems work can be shared more easily, since it’s all written down
- It’s easy to launch new infrastructure for development or new production environments
Our use of Terraform also makes us comfortable that we could handle many disaster recovery scenarios that would normally be daunting: we are already frequently creating new infrastructure, so we are confident in our workflows and that we understand all the pieces involved.
And best of all, we find the Terraform documentation to be incredibly comprehensive, consistent, and writing Terraform code is far less painful than clicking through a thousand different UIs on the AWS website.
Auto Scaling Everything
As much as possible, we avoid running anything as a one-off instance. Even our dev environments all use Auto Scaling Groups with a fixed size of one.
Its often overlooked, but the Auto Scaling Group is probably one of the biggest advantages of using a major cloud provider like AWS. It’s not even the scaling part that matters, but the ability to reliably ensure a given number of instances are running, and replacing failed instances automatically.
While an Auto Scaling Group doesn’t free you from having to design a system to handle failure, it does make it easier to recover from failure. Often, the process is completely automatic.
Several times since our launch a year and a half ago, failures of individual instances within our infrastructure have resulted in nothing more than two or three minutes of slightly increased response times as our Auto Scaling Group detects the failed instance and provisions a new one.
Kubernetes
At Geocode Earth we make heavy use of Kubernetes to build a scalable and reliable system.
While Kubernetes can bring a lot of complexity, we’ve found that using it gives us access to valuable safety nets that would otherwise require many individual tools.
Primarily, Kubernetes has many features that either eliminate entire classes of failure, or detect failure before it has a chance to impact live traffic.
For example, the powerful health checks can help prevent a deployment of bad code or configuration from shutting down perfectly working services and replacing them with broken ones. Believe it or not, this type of failure is one of the biggest causes of downtime, and the tools Kubernetes provides for avoiding them are well designed and highly effective.
Stateless workload where possible
There’s a saying in aviation:
A superior pilot uses their superior judgement to avoid situations which require the use of their superior skill.
Basically, it means that making your life more difficult than you have but managing anyway is a failure, rather than a success.
We take a similar approach to our infrastructure, and try to make the job of successfully managing it as easy as possible. One of the biggest ways to do this is to avoid stateful workloads.
There’s only one component of our infrastructure on Kubernetes that isn’t completely stateless: we use Redis for storing per-second request information for use by our rate limiting and API key management infrastructure. Even this system only stores state for a few seconds. In the case of any sort of incident, we can be back up and running immediately.
We lean heavily on services like S3 and EFS to turn stateful work into stateless. Wherever we can, we write off stateful data to a managed storage system, so that the service itself can remain stateless.
Even our Elasticsearch cluster, the one component of our infrastructure that is so performance and configuration critical that it’s managed outside of Kubernetes, is effectively stateless. All the data in Elasticsearch is read-only, and comes from snapshots stored on S3.
We never change the contents of these Elasticsearch clusters, but we can launch a new one with new data in just a few minutes.
Stay obsessive about end-user metrics
It’s easy to attempt to think about a system as being “up” or “down”, but reality is much more complicated.
Especially for a highly latency sensitive service like our autocomplete geocoding, returning responses slowly may be no better than not returning one at all.
Likewise, if a service returns success for 100% of health checks, but 1% of user requests result in a 500 error, does it really have 100% uptime?
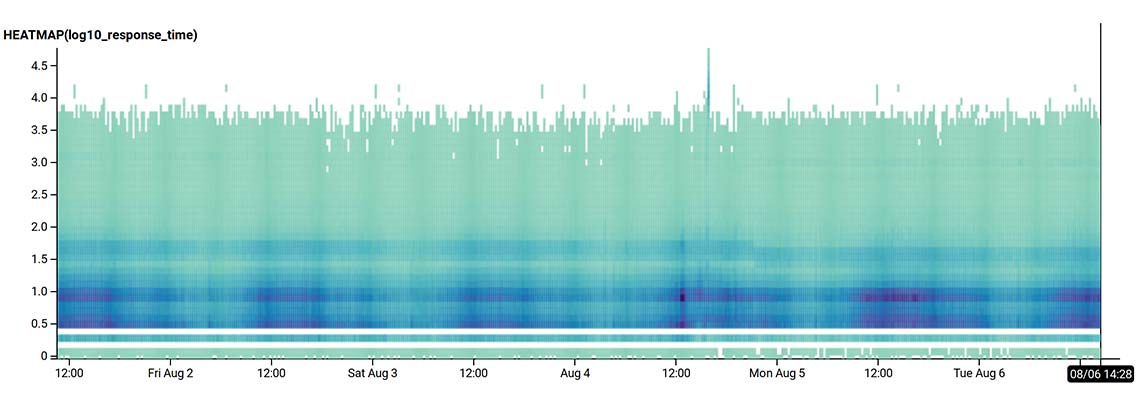
We closely monitor our service at a much higher level of granularity than a status dashboard can display.

Over the past few months, we’ve used this sort of insight to dramatically reduce response latency, and decrease the frequency of error or timeout responses, all while traffic has continued to increase as we grow our usage and customer base.
As time goes on, we’ll bring more of this highly detailed monitoring information into our status dashboards, and we’ll always be working to keep that board green.